It is possible to use a resource faster than it renews, in which case depletion occurs. Between 1980 and 2008, industrial agricultural operations in Saudi Arabia consumed at least 80% of the country’s fossil (nonrenewable) water reserves.1Fred Pearce, “Saudi Arabia Stakes a Claim on the Nile,” National Geographic News, December 19, 2012, accessed August 25, 2016, link; and Elie Elhadji, “Camels Don’t Fly, Deserts Don't Bloom: An Assessment of Saudi Arabia’s Experiment in Desert Agriculture,” Occassional Paper 48, May 2004, accessed August 25, 2016, link. Globally, much more groundwater is pumped out of aquifers than is recharged naturally, so the average water table has been declining. Hydrogeologists have observed significant declines in the Ogallala Aquifer under the Great Plains of the United States, spanning eight states from South Dakota down to Texas.2V. L. McGuire, Water-Level Changes in the High Plains Aquifer, Predevelopment to 2007, 2005–06, and 2006–07 (Reston, Virginia: U.S. Geological Survey, 2009), Scientific Investigations Report 2009-5019. Declines by as much as 71 meters (234 feet) were observed in Texas, while the average decline across the entire aquifer was 4.3 meters (14 feet). Storage of water declined from 3,950 to 3,580 cubic kilometers (3.2 to 2.9 billion acre-feet). While these numbers are daunting, the impacts on water in the aquifer were not negative in all locations. Localized increases up to 25.6 meters (84 feet) were observed in Nebraska as a consequence of seepages and reservoirs affecting the amount of water stored underground.
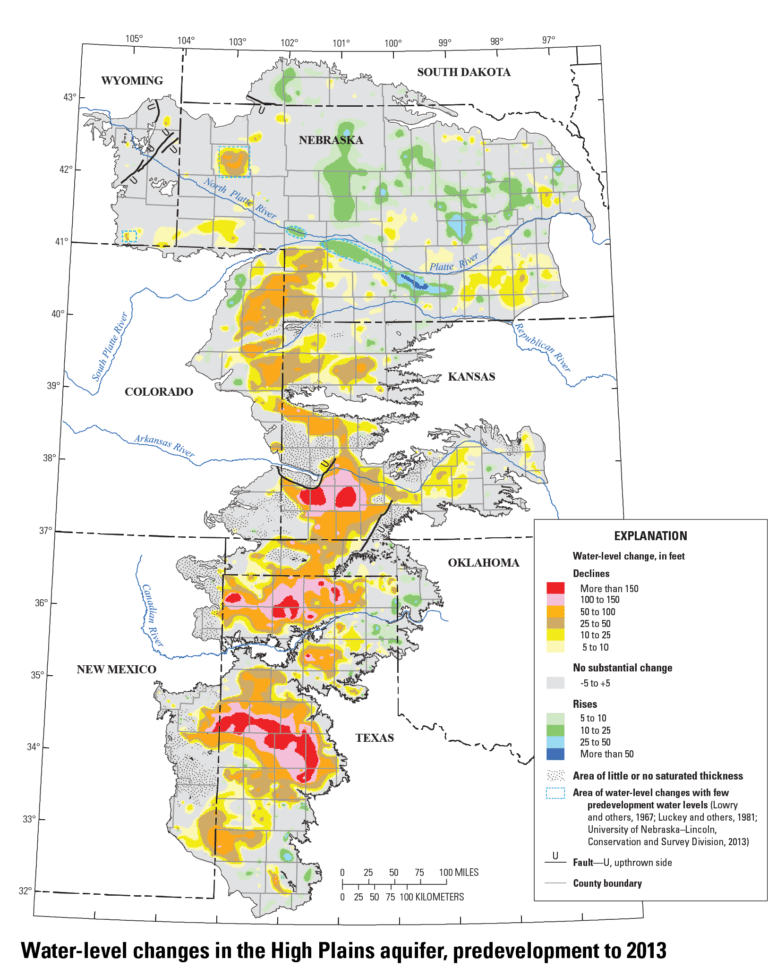
Source: USGS
These withdrawals from nonrenewable sources and shifts in water levels, stored water, and water use, affect the amount of water that is available to humanity and nature. Overall, water availability is declining globally.3Jill Boberg, Liquid Assets: How Demographic Changes and Water Management Policies Affect Freshwater Resources (Santa Monica: RAND Corporation, 2005); and C.J. Vorosmarty, et al., “Global threats to human water security and river biodiversity,” Nature 468 (2010), accessed August 30, 2016, doi:10.1038/nature09549. Water availability dropped from 17,000 cubic meters (m3) (4.5 million gallons) per person in 1950 to 7,000 m3 (1.8 million gallons) per person in 2000. Water stress occurs between 1,000 to 1,700 m3 (264,000 to 450,000 gallons), and a water crisis occurs at less than 1,000 m3. Notably, some countries are already at these levels, and are cause for concern: Qatar (91 m3), Libya (111 m3), Israel (389 m3) and the UK (1,222 m3). All of these data sets point to increasing water stress. Nearly 80% of the global population lives with high threats to water security.
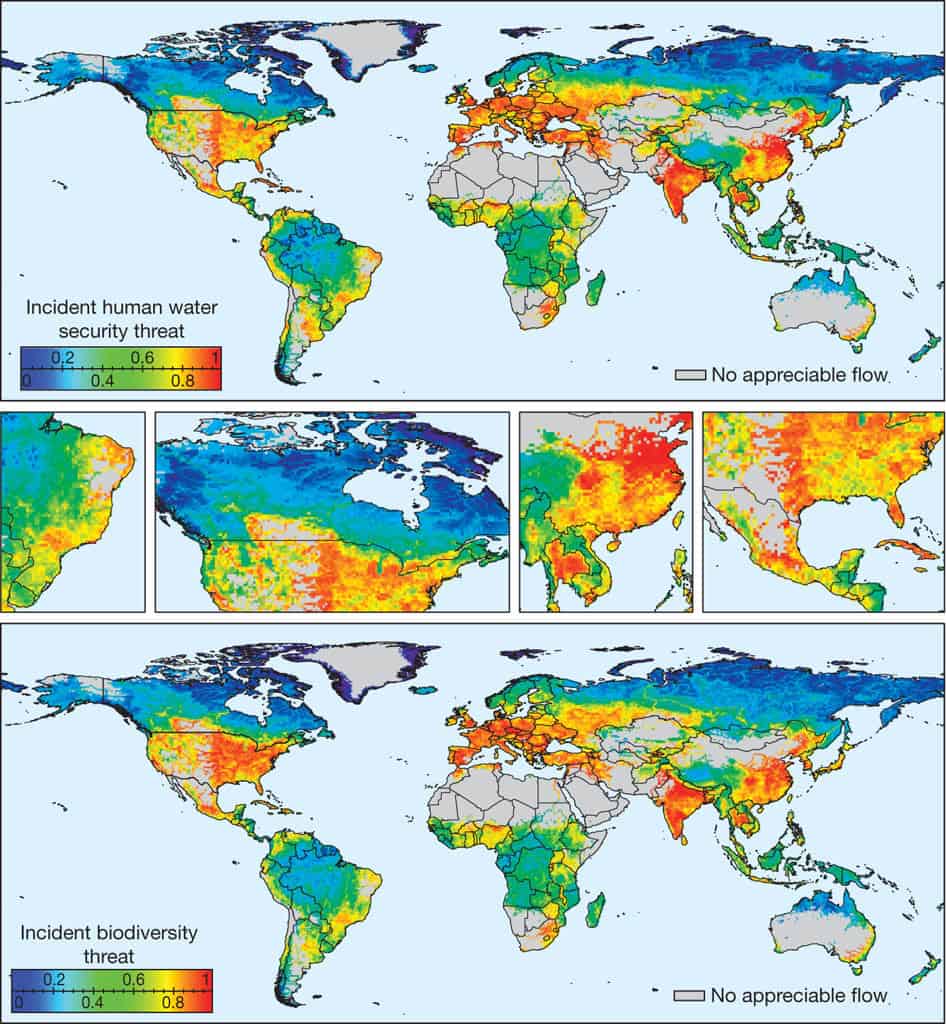
Source: Vorosmarty, et al, Nature
Perhaps one of the most impressive signs of overpumping is that a nontrival portion of ocean-level rise is from water that was pumped out of aquifers. The total rise was approximately 1.8 millimeters (mm) (0.071 inches) per year between 1963 and 2003.4Y. Pokhrel, et al., “Model estimates of sea-level change due to anthropogenic impacts on terrestrial water storage,” Nature Geoscience, 5 (2012). Scientists have found that a variety of water-use factors have caused the sea level to rise 0.7 mm (0.028 inches) per year between 1961 and 2003, which is about 42% of the observed total sea-level rise. Water-use factors include overuse of groundwater, artificial reservoir water impoundment, and climate-driven changes in terrestrial water storage. In other words, those significant volumes of water that were withdrawn from aquifers ultimately were dumped into the oceans after irrigation and runoff worked its way down rivers. So much water was removed from the aquifers that it caused the oceans to rise. Thermal expansion from the heating of the oceans and runoff of freshwater from melting snowcaps and glaciers, both of which have ties to climate change, contribute to the remaining 1.1 mm (0.043 inches).
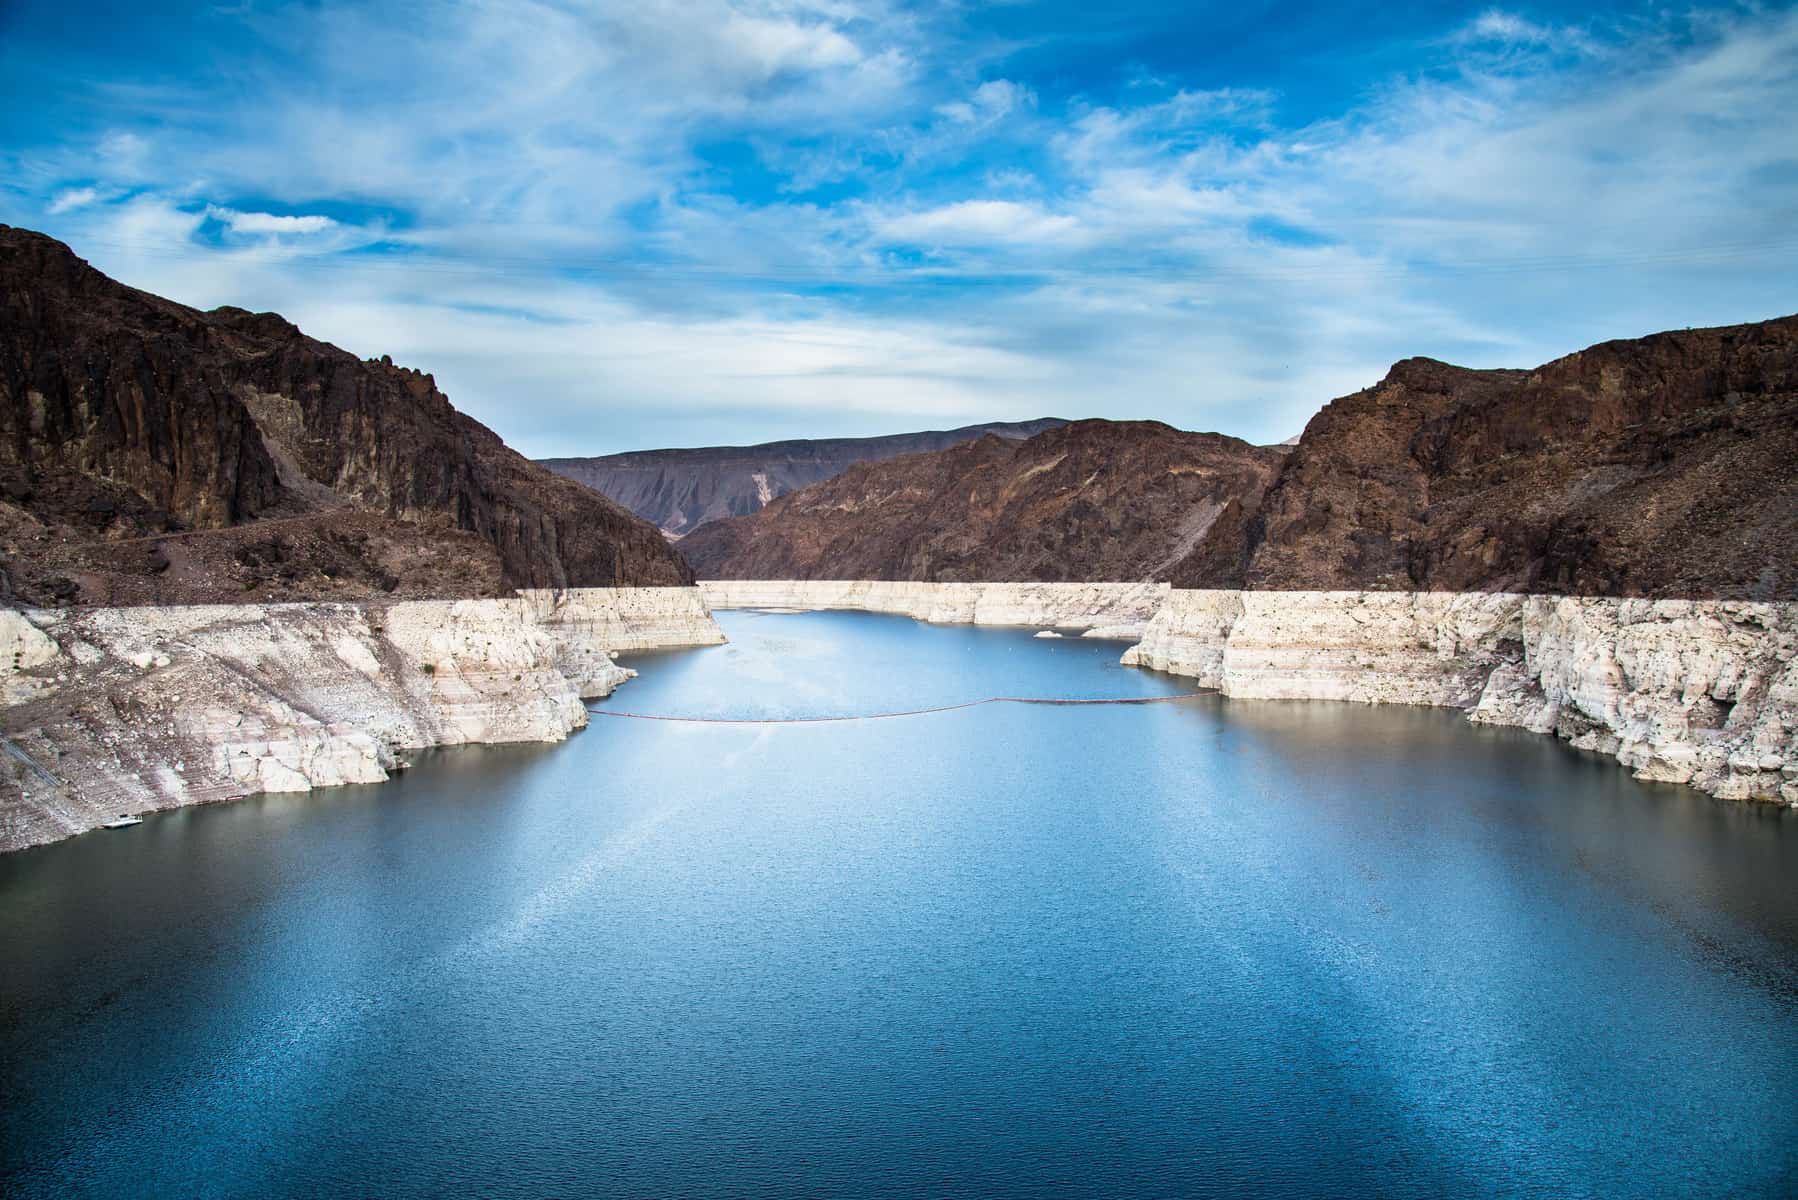
Image Credits: Kunal Mehta/Shutterstock.com.
Update your browser to view this website correctly.Update my browser now

